> For the complete documentation index, see [llms.txt](https://docs.apppaas.com/start/llms.txt). Markdown versions of documentation pages are available by appending `.md` to page URLs; this page is available as [Markdown](https://docs.apppaas.com/start/apppaas-guide/monitoring.md).
# 서비스 모니터링
서비스 생성 후 모니터링을 확인하는 방법을 설명합니다.
### 개요
***
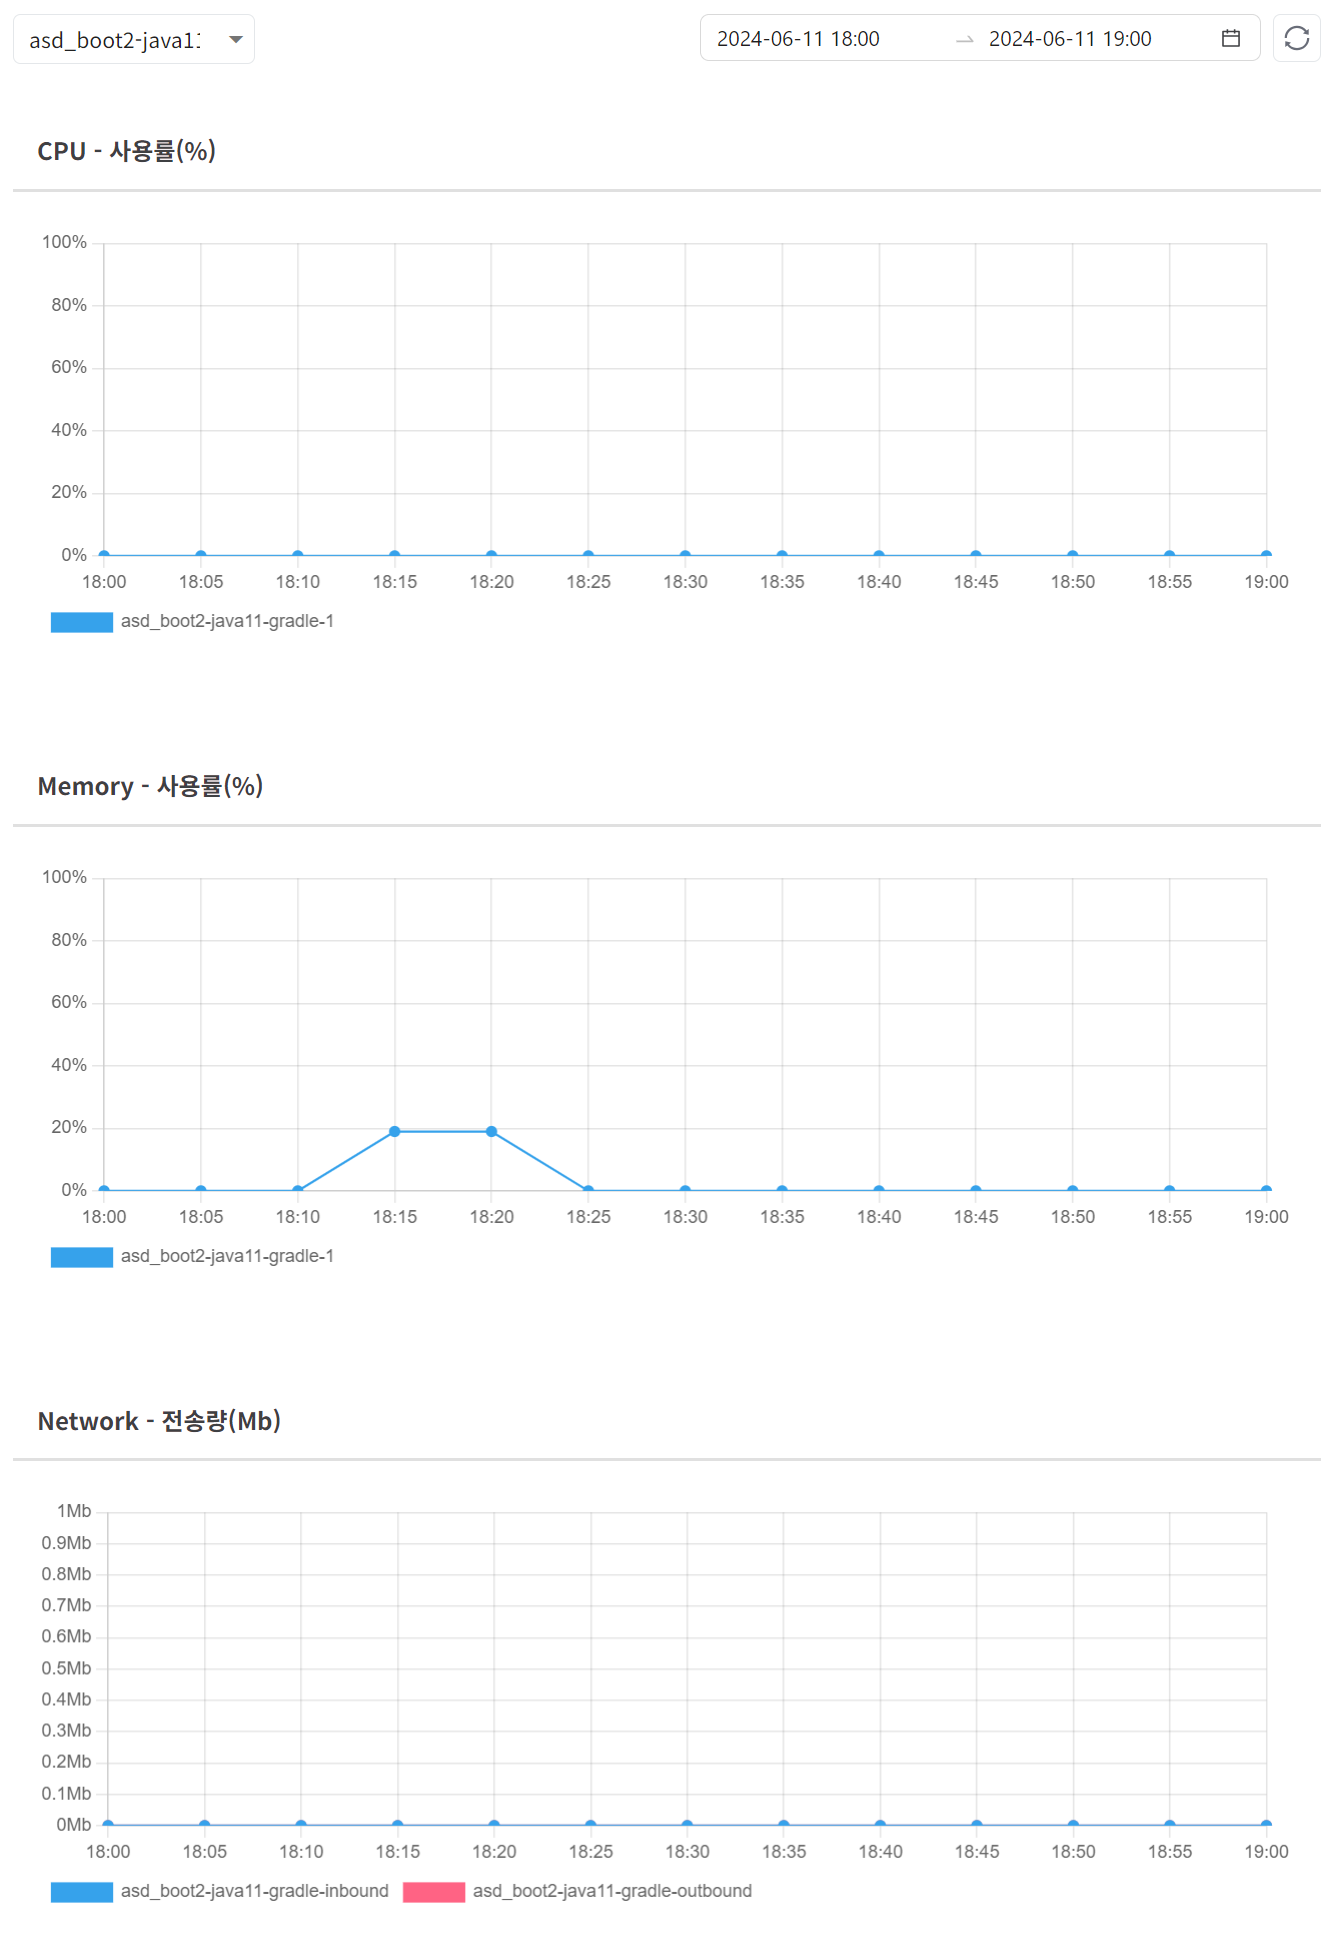
AppPaaS의 모니터링 기능은 서비스 배포 후 생성 된 서버의 \
CPU, Memory, Network(In/Out) 정보를 최대 7일간격으로 조회 할 수 있습니다.
{% hint style="info" %}
베타 서비스에서도 제한없이 모든 서비스에 대해 조회가 가능합니다.
{% endhint %}
최초 모니터링 페이지에 접근 시 현지 시간을 기준으로 1시간 이전의 정보를 즉시 확인 할 수 있습니다.
조회하고자 하는 일시를 선택하여 우측 새로고침 버튼 선택 시\
조회 기간에 따라 각 항목들의 X축 간격이 자동 조정됩니다.
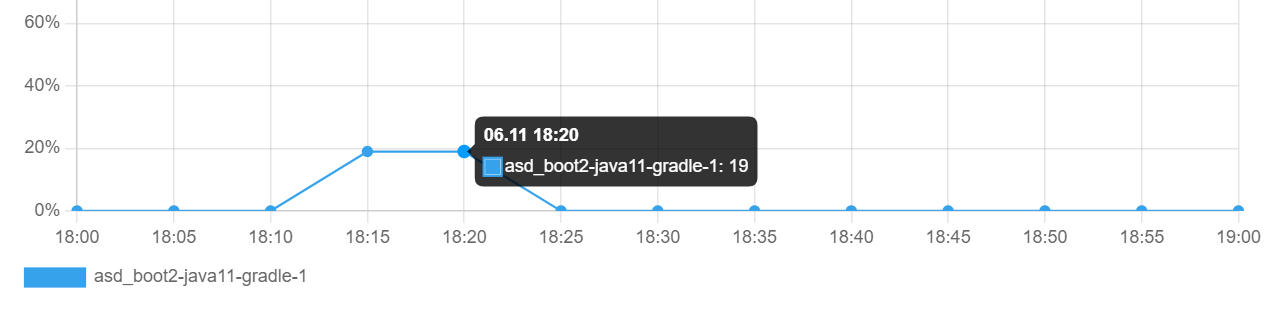
자세한 정보를 확인 하고 싶으시다면 마우스 커서를 그래프에 Hover 하는 경우 \
툴팁으로 상세한 정보를 확인 할 수 있습니다.